@hh.ru/react-d3-chart-graphs
v6.1.2
A javascript library for building charts components made with React.js and D3.js
0/weekUpdated 2 years agoMITUnpacked: 275.2 KB
Published by Andrei Gladkov
npm install @hh.ru/react-d3-chart-graphsReact-d3-chart-graphs
A javascript library for building charts based on d3.js@4.10.0
Allows you to easily build the following graph:
- Bar Chart
- Stacked Bar Chart
- GanttChart
- Box Plot
- ResponsiveWrapper
- LineChartTime
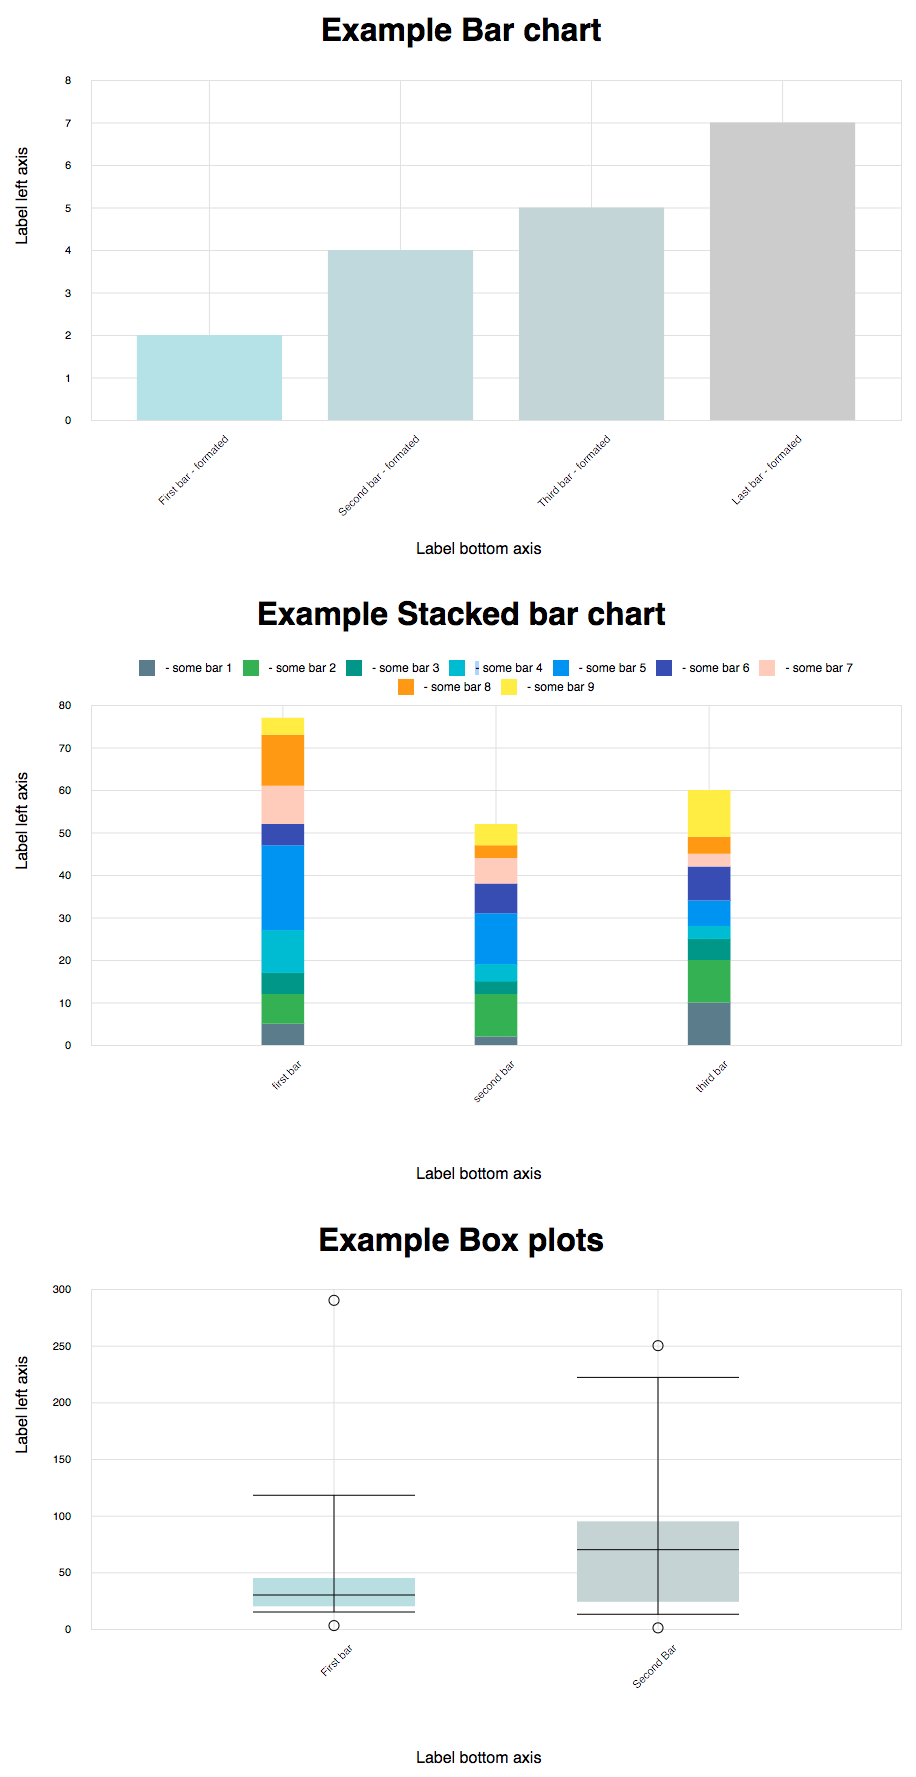
Bar Chart
A bar chart or bar graph is a chart or graph that presents grouped data with rectangular bars with lengths proportional
to the values that they represent. Only vertical bars are supported.
Consists of the following properties:
- axesProps.padding
- data - type: array of object.
Fields:
``
    {
        title: "title chart",
        value: 7
    }
- paddingMultiplier - type: Number (from 0 to 1). Default value = 0. Specifies an indent between bars.
- margins - type: object. Set canvas margins.
    Fields (default values):
        {
            top: 10,
            right: 10,
            bottom: 150,
            left: 80
        }
- colorScale - type Object. Sets the color of the bar, depending on the value on the y-axis with the help of the function
 d3-interpolate.
    Fields (default values):
        {
            min: '#B2EBF2'
            max: '#00BCD4',
        }
`
- handleBarClick - The click event is raised when the user clicks on the canvas. If user clicked on bar
argument - item of data and metrics current bar.
    Fields :
    {
        metrics: {
            left: 548
            top: 129
            width: 52
        },
        title: "title chart",
        value: 7
    }
If user click on canvas without bar, argument is
- handleBarHover - The mouseenter and mouseleave events. If user moved mouse in bar, first argument - item of data and
metrics current bar, second - event data.
`
    {
        metrics: {
            left: 548
            top: 129
            width: 52
        },
        title: "title chart",
        value: 7
    },
    event: {
        clientX,
        clientY,
    }
If user mouseleave bar or if user mouseenter on canvas without bar, arguments is
- toggleResize - type Boolean. Forced resizing by the parent, changing the current state to the opposite will resize.
Stacked Bar Chart
Bar graphs can also be used for more complex comparisons of data with grouped bar charts and stacked bar charts.
In a grouped bar chart, for each categorical group there are two or more bars.
Consists of the following properties:
- axesProps.padding
- data - type: array of object.
Fields:
`
     {
        "titleBar": "first bar",
        "key": "uId", //default titleBar
         "values": [
             {
                 "title": "BAR_1",
                 "value": 5
             },
             {
                 "title": "BAR_2",
                 "value": 7
             },
             {
                 "title": "BAR_3",
                 "value": 5
             },
             {
                 "title": "BAR_4",
                 "value": 10
             },
             {
                 "title": "BAR_5",
                 "value": 20
             },
             {
                 "title": "BAR_6",
                 "value": 5
             },
             {
                 "title": "BAR_7",
                 "value": 9
             },
             {
                 "title": "BAR_8",
                 "value": 12
             },
             {
                 "title": "BAR_9",
                 "value": 4
             }
         ]
     }
- stackColors -type: object. It is map colors to title data.
    Example:
    stackColors = {
        BAR_1: {
            color: '#607D8B', //bar color
            legend: 'some bar 1', // legend text
        },
        BAR_2: {
            color: '#4CAF50',
            legend: 'some bar 2',
        },
    }
- paddingMultiplier - type: Number (from 0 to 1). Default value = 0. Specifies an indent between bars.
- margins - type: object. Set canvas margins.
    Fields (default values):
        {
            top: 10,
            right: 10,
            bottom: 150,
            left: 80
        }
- handleBarClick - The click event is raised when the user clicks on the canvas. If user clicked on bar
argument - item of data and metrics current bar and titleBar is a title of stack bars.
    Fields :
    {
        metrics: {
            left: 548
            top: 129
            width: 52
        },
        title: "title chart",
        value: 7,
        titleBar: "first bar"
    }
If user click on canvas without bar, argument is - handleBarHover - The mouseenter and mouseleave events. If user moved mouse in bar, first argument - item of data and
metrics current bar, second - event data.metrics current bar.
    {
        metrics: {
            left: 548
            top: 129
            width: 52
        },
        title: "title chart",
        value: 7,
        titleBar: "first bar"
    },
    event: {
        clientX,
        clientY,
    }
If user mouseleave bar or if user mouseenter on canvas without bar, arguments is - toggleResize - type Boolean. Forced resizing by the parent, changing the current state to the opposite will resize.
Gantt Chart
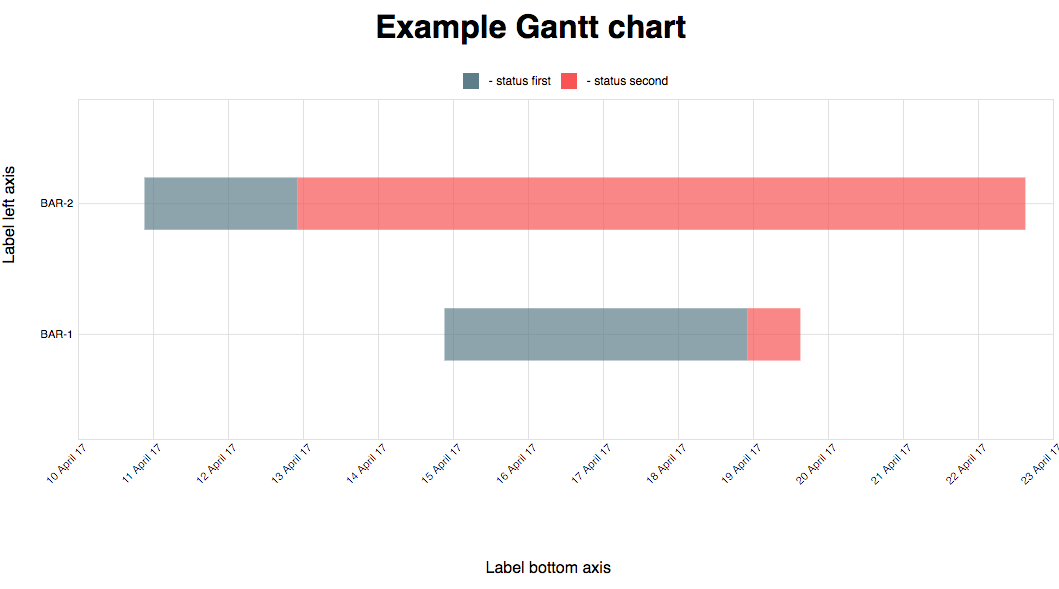
A Gantt chart is a type of bar chart that illustrates a project schedule.
Consists of the following properties:
- axesProps.padding
- data - type: array of object.
Fields:
     {
        titleBar: 'BAR_1 bar',
        key: 'uId', //default titleBar
        values: [
             {
                 title: 'status-1',
                 dateStart: 'Fri, 10 Apr 2017 18:16:05 GMT',
                 dateEnd: 'Tue, 12 Apr 2017 19:10:06 GMT',
             },
             {
                 title: 'status-2',
                 dateStart: 'Tue, 12 Apr 2017 19:10:06 GMT',
                 dateEnd: 'Tue, 14 Apr 2017 19:10:06 GMT',
             }
         ]
     }
- stackColors -type: object. It is map colors to title data.
    Example:
    stackColors = {
        status-1: {
            color: '#607D8B', //bar color
            legend: 'status first', // legend text
        },
        status-2: {
            color: '#4CAF50',
            legend: 'status second',
        },
    }
- paddingMultiplier - type: Number (from 0 to 1). Default value = 0. Specifies an indent between bars.
- margins - type: object. Set canvas margins.
    Fields (default values):
        {
            top: 10,
            right: 10,
            bottom: 150,
            left: 80
        }
- handleBarClick - The click event is raised when the user clicks on the canvas. If user clicked on bar
argument - item of data and metrics current bar and titleBar is a title of stack bars.
    Fields :
    {
        metrics: {
            left: 548
            top: 129
            width: 52
        },
        title: 'title chart',
        dateStart: 'Tue, 12 Apr 2017 19:10:06 GMT',
        dateEnd: 'Tue, 14 Apr 2017 19:10:06 GMT',
        titleBar: 'first bar'
    }
If user click on canvas without bar, argument is - handleBarHover - The mouseenter and mouseleave events. If user moved mouse in bar, argument - first argument - item of data and
metrics current bar, second - event data.
    {
        metrics: {
            left: 548
            top: 129
            width: 52
        },
        title: 'title chart',
        dateStart: 'Tue, 12 Apr 2017 19:10:06 GMT',
        dateEnd: 'Tue, 14 Apr 2017 19:10:06 GMT',
        titleBar: 'first bar'
    },
    event: {
        clientX,
        clientY,
    }
If user mouseleave bar or if user mouseenter on canvas without bar, arguments is - toggleResize - type Boolean. Forced resizing by the parent, changing the current state to the opposite will resize.
Box Plot
Bar graphs is a method for graphically depicting groups of numerical data through their quartiles.
Consists of the following properties:
- axesProps.padding
- data - type: array of object.
Fields:
     {
         title: 'First bar',
         numbers: {
             min: 15,
             max: 218,
             median: 30,
             quartiles: [20, 45],
         },
         outliers: [{
             key: 'First',
             value: 289,
             title: 'text',
         }],
     }
- colorScale - type Object. Sets the color of the bar, depending on the value on the y-axis with the help of the function
 d3-interpolate.
    Fields (default values):
        {
            min: '#B2EBF2'
            max: '#00BCD4',
        }
- paddingMultiplier - type: Number (from 0 to 1). Default value = 0. Specifies an indent between bars.
- margins - type: object. Set canvas margins.
    Fields (default values):
`
        {
            top: 10,
            right: 10,
            bottom: 150,
            left: 80
        }
- handleBarClick - The click event is raised when the user clicks on the bar.
Argument - item of data and metrics current bar.
    Fields :
    {
        metrics: {
            left: 548
            top: 129
            width: 52
        },
        title: "title chart",
        values: {
             min: 7,
             max: 118,
             median: 20,
             quartiles: {
                 min: 15,
                 max: 40,
             },
        },
        outliers: {
            min: 2,
            max: 220,
        },
        titleBar: "first bar"
    }
- handleOutlierClick - The click event is raised when the user clicks on the outlier.
 Argument - item of data and metrics current Circle.
     {
         metrics: {
             left: 548
             top: 129
             width: 5
         },
         title: 'First bar',
         values: {
             min: 7,
             max: 118,
             median: 20,
             quartiles: {
                 min: 15,
                 max: 40,
             },
         },
         outliers: {
             min: 2,
             max: 220,
         }
     }
- handleBarHover - The mouseenter and mouseleave events. If user moved mouse in bar, first argument - item of data and
metrics current bar, second - event data.
    {
        metrics: {
            left: 548
            top: 129
            width: 52
        },
        title: 'First bar',
        values: {
            min: 7,
            max: 118,
            median: 20,
            quartiles: {
                min: 15,
                max: 40,
            },
        },
        outliers: {
            min: 2,
            max: 220,
        }
    },
    event: {
        clientX,
        clientY,
    }
If user mouseleave bar or if user mouseenter on canvas without bar, arguments is - toggleResize - type Boolean. Forced resizing by the parent, changing the current state to the opposite will resize.
Axes props
- axesProps.legend.xAxis || yAxis - Text on legend
- axesProps.padding.xAxis || yAxis - If padding is specified, sets the padding to the specified value in pixels and
returns the axis. Default value = 5px. d3-axis tickPadding
- axesProps.ticksCount.xAxis || yAxis - d3-axis tickArguments.
Default value = 4.
- axesProps.tickFormat.xAxis || yAxis - If format is specified, sets the tick format function and returns the axis.
d3-axis axis_tickFormat.
Example params:
    axesProps = {
        label: { //Label text on legend
            xAxis: 'Label bottom axis',
            yAxis: 'Label left axis'
        },
        padding: {
            xAxis: 20,
            yAxis: 20
        },
        ticksCount: 6,
        tickFormat: {
            xAxis: function(value) {
                return value + 'mm';
            }
        }
    }
Axes
Component for creating chart's axes. Has the following props:
-
-
-
-
- see AxesProps.legend
- padding see AxesProps.padding
- ticksCount see AxesProps.ticksCount
- tickFormat see AxesProps.tickFormatResponsive Wrapper
Wrapper component that expands to container's width. Forwards
parentWidth prop to wrapped component.Example:
`js
import {Component} from 'react';
import {ResponsiveWrapper} from '@hh.ru/react-d3-chart-graphs';class MyComponent extends Component {
render() {
const { parentWidth } = this.props;
// ...
}
}
export default ResponsiveWrapper(MyComponent);
`
Line Chart Time
Line charts are used to display trends over time. Use a "line chart time" if you have dates on the horizontal axis.Consists of the following properties:
- axesProps.padding
- data - type: array of object.
Fields:
    {
        title: 'First',
        values: [
            {
                date: 'Fri, 30 Jun 2017 00:00:00 GMT',
                value: 0.04918032786885246,
            },
        ],
    }
- margins - type: object. Set canvas margins.
    Fields (default values):
        {
            top: 10,
            right: 10,
            bottom: 150,
            left: 80
        }
- stackColors -type: object. It is map colors to title data.
    Example:
    stackColors = {
        First: {
            color: '#607D8B', //bar color
            legend: 'some bar 1', // legend text
        },
    }
- hideCircles -type: Boolean. Hide "circles" data point.
- handleCircleHover - The mouseenter and mouseleave events. If user moved mouse in Circle, first argument - item of data
and metrics current Circle, second - event data.
    {
        metrics: {
            left: 548
            top: 129
            width: 52
        },
        title: 'First',
        item: {
            date: 'Fri, 30 Jun 2017 00:00:00 GMT',
            value: 0.04918032786885246,
        }
    }
    event: {
        clientX,
        clientY,
    }
If user mouseleave bar or if user mouseenter on canvas without Circle, arguments is - toggleResize - type Boolean. Forced resizing by the parent, changing the current state to the opposite will resize.
Examples and development
NODE_ENV=development yarn wepack && cd examples && yarn start
$3
* First release
* Add bar chart and stacked bar chart
$3
* Changed data props field in Stacked bar chart
$3
* Changed data props stackColors in Stacked bar chart (added legend text)
$3
* Changed development build, fix uglify.
$3
* Add box plot.
$3
* Corrected the positioning of the bar in BoxPlot
$3
* Export Axes and ResponsiveWrapper, change axesProps.ticksCount format.
$3
* Add handleEjectionClickMinClick, handleEjectionMaxClick in BoxPlot
$3
Fix boxPlot mousemove
$3
Rename click handlers BoxPlot
$3
Export Legends
$3
Add Gantt Chart
$3
Add tickCount props to Axes GanttChart
$3
Rename ejections to outliers, add outliers' hover handlers
$3
Introduce handleOutlierClick and handleOutlierHover, update box plot chart's appearance
$3
Add second argument event to hover
$3
Update react and react-dom to 16.0 version and fix box plot
$3
Bug fixes
$3
Add chart LineChartTime
$3
Make Gantt chart height adaptive
$3
Add render prop to Gantt chart.
$3
Updated dependencies
$3
Up webpack version
$3
Up react-scripts version in examples
$3
Add graph component