@modelcontextprotocol/server-cohort-heatmap
v1.0.1TypeScript
Cohort heatmap MCP App Server for retention analysis
99/weekUpdated 2 days agoMITUnpacked: 3.3 MB
Published by jspahrsummers
npm install @modelcontextprotocol/server-cohort-heatmapExample: Cohort Heatmap App
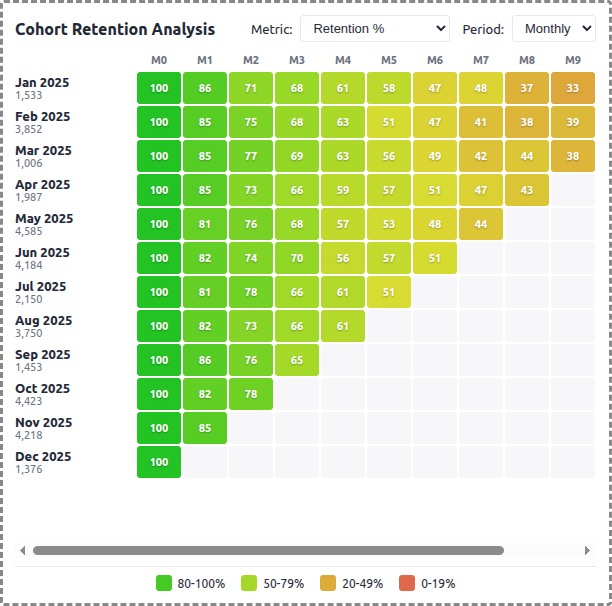
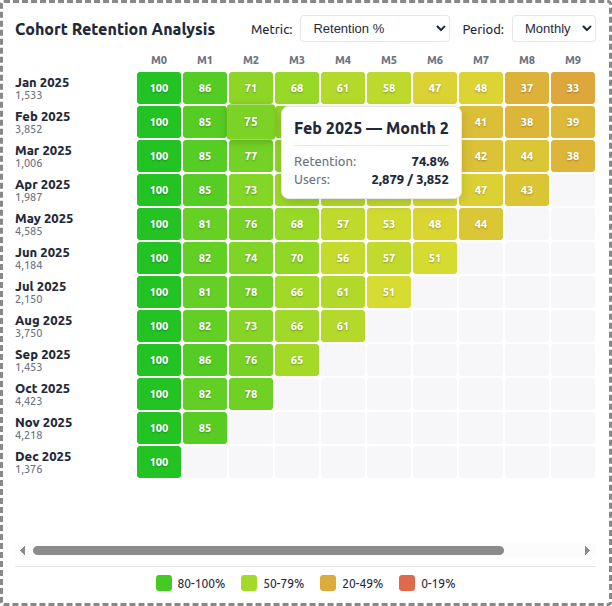
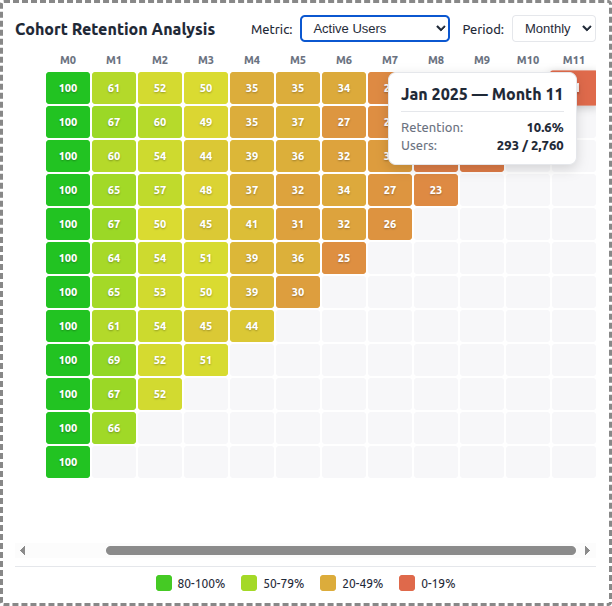
A demo MCP App that displays cohort retention data as an interactive heatmap, showing customer retention over time by signup month.
 |  |  |
MCP Client Configuration
Add to your MCP client configuration (stdio transport):
``json`
{
"mcpServers": {
"cohort-heatmap": {
"command": "npx",
"args": [
"-y",
"--silent",
"--registry=https://registry.npmjs.org/",
"@modelcontextprotocol/server-cohort-heatmap",
"--stdio"
]
}
}
}
$3
To test local modifications, use this configuration (replace ~/code/ext-apps with your clone path):
`json`
{
"mcpServers": {
"cohort-heatmap": {
"command": "bash",
"args": [
"-c",
"cd ~/code/ext-apps/examples/cohort-heatmap-server && npm run build >&2 && node dist/index.js --stdio"
]
}
}
}
Features
- Cohort Retention Heatmap: Color-coded grid showing retention percentages across cohorts and time periods
- Multiple Metrics: Switch between Retention %, Revenue Retention, and Active Users
- Period Types: View data by monthly or weekly intervals
- Interactive Exploration: Hover cells for detailed tooltips, click to highlight rows/columns
- Color Scale: Green (high retention) through yellow to red (low retention)
- Theme Support: Adapts to light/dark mode preferences
Running
1. Install dependencies:
`bash`
npm install
2. Build and start the server:
`bash`
npm run start:http # for Streamable HTTP transport
# OR
npm run start:stdio # for stdio transport
3. View using the basic-host example or another MCP Apps-compatible host.
Architecture
$3
Exposes a single get-cohort-data` tool that returns:
- Cohort rows with signup month, original user count, and retention cells
- Period headers and labels
- Configurable parameters: metric type, period type, cohort count, max periods
The tool generates synthetic cohort data using an exponential decay model with configurable retention curves per metric type.
$3
- Uses React for the heatmap visualization
- Fetches data on mount and when filters change
- Displays retention percentages in a grid with HSL color interpolation
- Shows detailed tooltips on hover with user counts and exact retention values
- Supports row/column highlighting on cell click