@modelcontextprotocol/server-scenario-modeler
v1.0.1TypeScript
Financial scenario modeling MCP App Server
0/weekUpdated 2 days agoMITUnpacked: 3.6 MB
Published by jspahrsummers
npm install @modelcontextprotocol/server-scenario-modelerExample: SaaS Scenario Modeler
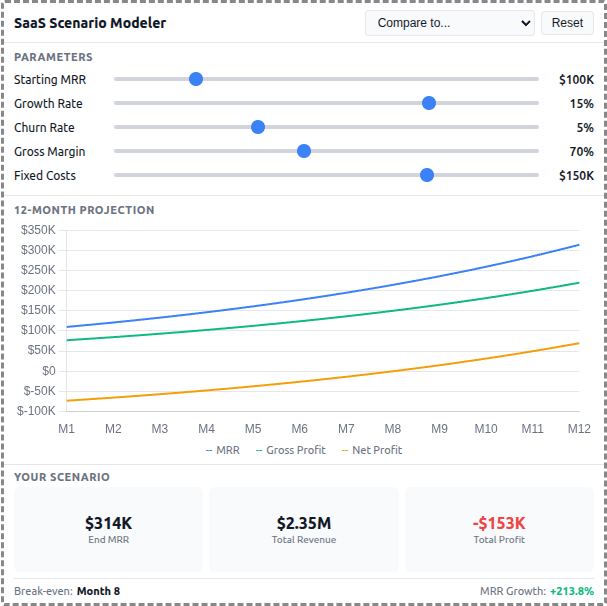
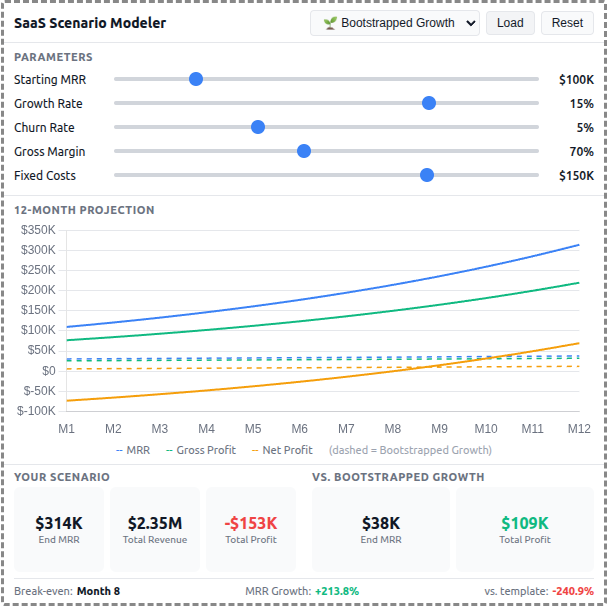
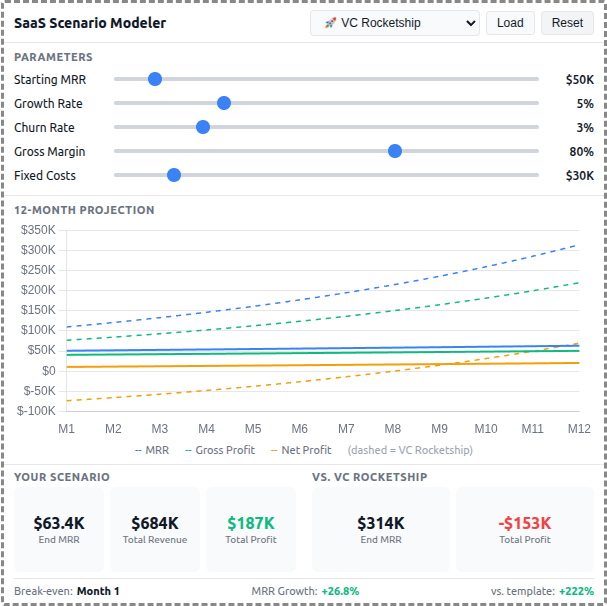
A React-based demo MCP App that lets users adjust SaaS business parameters and see real-time 12-month projections of revenue, costs, and profitability with comparison against pre-built scenario templates.
 |  |  |
MCP Client Configuration
Add to your MCP client configuration (stdio transport):
``json`
{
"mcpServers": {
"scenario-modeler": {
"command": "npx",
"args": [
"-y",
"--silent",
"--registry=https://registry.npmjs.org/",
"@modelcontextprotocol/server-scenario-modeler",
"--stdio"
]
}
}
}
$3
To test local modifications, use this configuration (replace ~/code/ext-apps with your clone path):
`json`
{
"mcpServers": {
"scenario-modeler": {
"command": "bash",
"args": [
"-c",
"cd ~/code/ext-apps/examples/scenario-modeler-server && npm run build >&2 && node dist/index.js --stdio"
]
}
}
}
Features
- Interactive Parameters: 5 sliders for Starting MRR, Growth Rate, Churn Rate, Gross Margin, and Fixed Costs
- 12-Month Projections: Line chart showing MRR, Gross Profit, and Net Profit over time
- Scenario Templates: 5 pre-built business strategies (Bootstrapped, VC Rocketship, Cash Cow, Turnaround, Efficient Growth)
- Template Comparison: Overlay dashed lines to compare your scenario against any template
- Summary Metrics: Key metrics including Ending MRR, Total Revenue, Total Profit, and break-even month
- Theme Support: Adapts to light/dark mode preferences
Running
1. Install dependencies:
`bash`
npm install
2. Build and start the server:
`bash`
npm run start:http # for Streamable HTTP transport
# OR
npm run start:stdio # for stdio transport
3. View using the basic-host example or another MCP Apps-compatible host.
Architecture
$3
Exposes a single get-scenario-data tool that returns:
- 5 pre-built scenario templates with parameters, projections, and summaries
- Default input values for the sliders
- Optionally computes custom projections when customInputs are provided
The tool is linked to a UI resource via _meta.ui.resourceUri.
$3
- Built with React for reactive slider updates and derived state management
- Uses Chart.js for the line chart visualization
- All projection calculations run client-side for instant slider feedback
- Components: SliderRow, MetricCard, ProjectionChart`
- Template comparison shown as dashed overlay lines on the chart