@syncfusion/ej2-maps
v32.2.3TypeScript
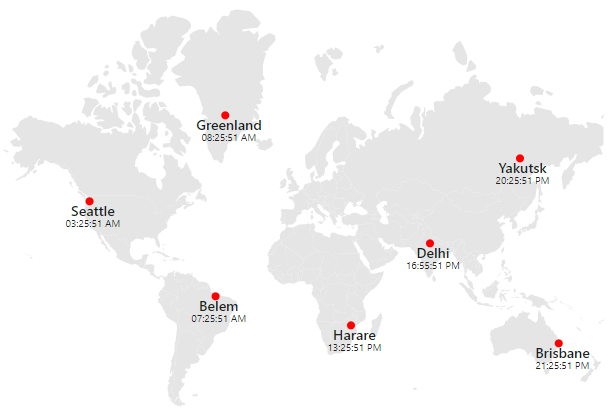
The Maps component is used to visualize the geographical data and represent the statistical data of a particular geographical area on earth with user interactivity, and provides various customizing options
0/weekUpdated 4 days agoSEE LICENSE IN licenseUnpacked: 11.1 MB
Published by Syncfusion Inc.
npm install @syncfusion/ej2-mapsJavaScript Maps Control
The JavaScript Maps control is used to visualize geographical data and represent statistical data of a specific geographical area on earth with user interactivity, and it provides a wide range of customization options.
Getting started .
Online demos .
Learn more
Trusted by the world's leading companies

Setup
To install the Maps and its dependent packages, use the following command.
``sh``
npm install @syncfusion/ej2-maps
Supported frameworks
Maps control is also offered in the following list of frameworks.
| 
Angular | 
React | 
Vue | 
ASP.NET Core | 
ASP.NET MVC |
| :-----: | :-----: | :-----: | :-----: | :-----: |
Showcase samples
* Heat map - Live Demo
* Flight routes - Live Demo
* Bus seat booking - Live Demo
Key features
* Data sources: Binds the maps control to an array of JSON objects containing GeoJSON data.
* Map providers: Online map providers such as OpenStreetMap, Bing Maps and others can also be rendered.
* Layer: Layer represents the area which renders the map. Also, any number of layers can be added.
* Projection: Maps can be rendered in eight different types of projections.
* Drill-down: Provides drill-down option to have a closer look at the lower level of a hierarchy.
* Marker: Provides support to mark a specific place of interest in the map.
* Data label: Provides additional information about the shapes in the form of text over the shapes.
* Bubble: Represents visually the underlying data values of the shapes.
* Navigation line: Denotes the path between two locations.
* Color mapping: Applies colors to the shapes based on various conditions. Maps supports three types of color mapping: range color mapping, equal color mapping and desaturation color mapping.
* Legend: Summarizes the information from the layers, markers and bubbles.
* Annotation: Uses any custom HTML element as annotation and place it anywhere on the maps.
* Selection and highlight: Supports selecting or highlighting shapes to bring center of attraction.
* Zooming and panning: Allows to zoom in, zoom out, and pan the map to show in-depth information.
* Tooltip: Provides additonal information about the shapes on hover.
* Print and Export: Prints or exports the rendered maps to a desired format. Exporting supports four formats: PDF, PNG, JPEG and SVG.
* Templates: Templates can be used to create custom user experiences in the Maps.
* Globalization: Personalize the Maps control with different languages, as well as culture-specific number, date and time formatting.
* Accessibility: Provides with built-in accessibility support which helps to access all the Maps control features through the keyboard, screen readers, or other assistive technology devices.
Resources
* Documentation
* Theme Studio
* Custom Resource Generator
* What's New
* Road Map
* E-Books
Support
Product support is available through the following mediums.
* Support ticket - Guaranteed Response in 24 hours | Unlimited tickets | Holiday support
* Community forum
* GitHub issues
* Request feature or report bug
* Live chat
Changelog
Check the changelog here. Get minor improvements and bug fixes every week to stay up to date with frequent updates.
License and copyright
> This is a commercial product and requires a paid license for possession or use. Syncfusion’s licensed software, including this control, is subject to the terms and conditions of Syncfusion's EULA. To acquire a license for 140+ JavaScript UI controls, you can purchase or start a free 30-day trial.
> A free community license is also available for companies and individuals whose organizations have less than $1 million USD in annual gross revenue and five or fewer developers.
See LICENSE FILE for more info.
© Copyright 2026 Syncfusion® Inc. All Rights Reserved. The Syncfusion® Essential Studio® license and copyright applies to this distribution.