dc-population-pyramid
v1.0.0
DC Population Pyramid
11/weekUpdated 3 years agoUnpacked: 472.2 KB
Published by populate
npm install dc-population-pyramidDC.js Population Pyramid


Table of Contents
- Installation
- Requirements
- How to use
- Example
- Development
Installation
As a module with NPM or YARN
``bash
npm
npm i dc-population-pyramid --save-dev
yarn
yarn add dc-population-pyramid
`
Requirements
How to use
javascript
import pyramidPopulation from "dc-population-pyramid";
import crossfilter from "crossfilter2";
import { chartRegistry, renderAll } from "dc";
`The pyramid is divided into two charts, one for the left side and one for the right side. That is important because when we apply methods like .on("filtered"), we must use it to both.
javascript
chart.leftChart().on("filtered", function () {
  chart.leftChart().redraw();
});chart.rightChart().on("filtered", function () {
  chart.rightChart().redraw();
});
`First, we are going to create a dimension for the age groups. In the example, we divide by tens. You can apply any age division.
javascript
ageGenderDimension = ndx.dimension(function (d) {
      let age_range;      if (d.age <= 9) {
        age_range = "0 - 9";
      } else if (d.age <= 19) {
        age_range = "10 - 19";
      } else if (d.age <= 29) {
        age_range = "20 - 29";
      } else if (d.age <= 39) {
        age_range = "30 - 39";
      } else if (d.age <= 49) {
        age_range = "40 - 49";
      } else if (d.age <= 59) {
        age_range = "50 - 59";
      } else if (d.age <= 69) {
        age_range = "60 - 69";
      } else if (d.age <= 79) {
        age_range = "70 - 79";
      } else if (d.age <= 89) {
        age_range = "80 - 89";
      } else if (d.age <= 99) {
        age_range = "90 - 99";
      } else if (d.age >= 100) {
        age_range = "100+";
      }      return [d.gender, age_range];
    })
`We'll create a group
javascript
const group = {
    all: function () {
      var age_ranges = [
        "0 - 9",
        "10 - 19",
        "20 - 29",
        "30 - 39",
        "40 - 49",
        "50 - 59",
        "60 - 69",
        "70 - 79",
        "80 - 89",
        "90 - 99",
        "100+"
      ];      // convert to object so we can easily tell if a key exists
      let values = {};
      ageGenderGroup.all().forEach(function (d) {
        values[d.key[0] + "." + d.key[1]] = d.value;
      });      // convert back into an array for the chart, making sure that all age_ranges exist
      let g = [];
      age_ranges.forEach(function (age_range) {
        g.push({
          key: ["Male", age_range],
          value: values["Male." + age_range] || 0
        });
        g.push({
          key: ["Female", age_range],
          value: values["Female." + age_range] || 0
        });
      });      return g;
    }
  };
`We can change the color of the chart with the dc.js function colorCalculator.
javascript
chart.options({
  colorCalculator({ key }) {
    if (key[0] === "Male") {
      return "#5A9BCA";
    }
    return "#C95AC7";
  }
})
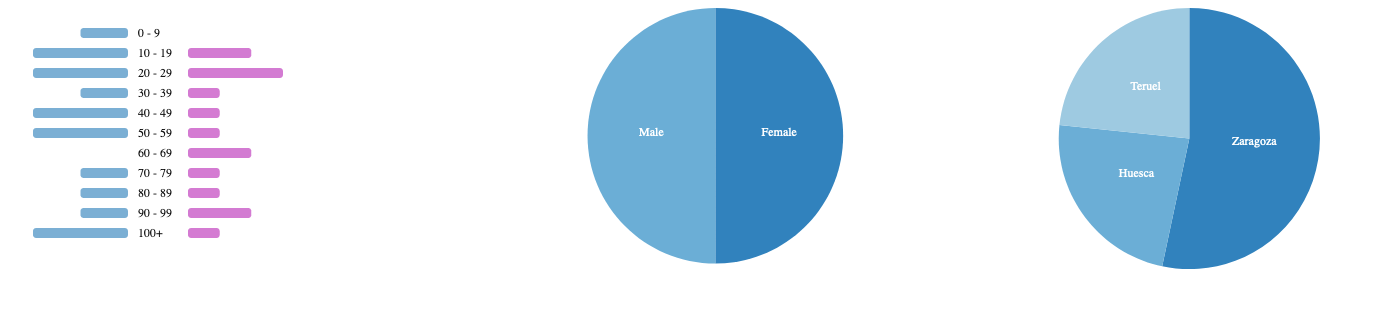
``Example
Pyramid population
Development
- Clone the repo
- Install dependencies
- Start coding!
- Send a PR