lighthouse-ci
v1.13.1
CLI implementation for running Lighthouse with any CI tool
0/weekUpdated 3 years agoMITUnpacked: 36.2 KB
Published by Andrea Sonny
npm install lighthouse-ciLighthouse CI


> A useful wrapper around Google Lighthouse CLI
NOTE
#### Node v12 is now the minimum required version starting from Lighthouse CI v.1.13.0
![]()

Install
``
$ npm install -g lighthouse-ci
Table of Contents
- Lighthouse CI
- NOTE
- Node v12 is now the minimum required version starting from Lighthouse CI v.1.13.0
- Install
- Table of Contents
- Usage
- CLI
- Lighthouse flags
- Chrome flags
- Configuration
- Budgets
- Option 1.
- Option 2.
- Option 3.
- Performance Budget
- Timing Budget
- Codechecks
- Demo App
- How to
- Test a page that requires authentication
- Wait for post-load JavaScript to execute before ending a trace
- Contributors
- License
Usage
`sh`
lighthouse-ci --help
CLI
`
$ lighthouse-ci --help
Usage
$ lighthouse-ci
Example
$ lighthouse-ci https://example.com
$ lighthouse-ci https://example.com -s
$ lighthouse-ci https://example.com --score=75
$ lighthouse-ci https://example.com --accessibility=90 --seo=80
$ lighthouse-ci https://example.com --accessibility=90 --seo=80 --report=folder
$ lighthouse-ci https://example.com --report=folder --config-path=configs.json
Options
-s, --silent Run Lighthouse without printing report log
--report=
--filename=
-json, --jsonReport Generate JSON report in addition to HTML (requires --report)
--config-path The path to the Lighthouse config JSON (read more here: https://github.com/GoogleChrome/lighthouse/blob/master/docs/configuration.md)
--budget-path The path to the Lighthouse budgets config JSON (read more here: https://developers.google.com/web/tools/lighthouse/audits/budgets)
--score=
--performance=
--pwa=
--accessibility=
--best-practice=
--best-practices=
--seo=
--fail-on-budgets Specify CI should fail if budgets are exceeded
--budget.
In addition to listed "lighthouse-ci" configuration flags, it is also possible to pass any native "lighthouse" flag
To see the full list of available flags, please refer to the official Google Lighthouse documentation at https://github.com/GoogleChrome/lighthouse#cli-options
`
Lighthouse flags
In addition to listed lighthouse-ci configuration flags, it is also possible to pass any native lighthouse flags.
To see the full list of available flags, please refer to the official Google Lighthouse documentation.
eg.
`sh./test-report/Launches browser, collects artifacts, saves them to disk (in
) and quits./test-report/
$ lighthouse-ci --gather-mode=test-report https://my.website.comskips browser interaction, loads artifacts from disk (in
), runs audits on them, generates report`
$ lighthouse-ci --audit-mode=test-report https://my.website.com
$3
In addition of the lighthouse flags, you can also specify extra chrome flags
comma separated.
eg.
`sh`
$ lighthouse-ci --chrome-flags=--cellular-only,--force-ui-direction=rtl https://my.website.com
eg.
`sh`
$ lighthouse-ci --emulated-form-factor desktop --seo 92 https://my.website.com
Configuration
Lighthouse CI allows you to pass a custom Lighthouse configuration file.
Read Lighthouse Configuration
to learn more about the configuration options available.
Just generate your configuration file. For example this config.json
`json
{
"extends": "lighthouse:default",
"audits": [
"user-timings",
"critical-request-chains"
],
"categories": {
"performance": {
"name": "Performance Metrics",
"description": "Sample description",
"audits": [
{"id": "user-timings", "weight": 1},
{"id": "critical-request-chains", "weight": 1}
]
}
}
}
`
Then run Lighthouse CI with the --config-path flag
`sh`
$ lighthouse-ci https://example.com --report=reports --config-path=config.json
The generated report inside reports folder will follow the custom configuration listed under the config.json file.
Budgets
Lighthouse CI allows you to pass a budget configuration file (see Lighthouse Budgets).
There are several options to pass a budget config:
#### Option 1.
Add configurations to your config.json file like and use instructions above.` json`
{
"extends": "lighthouse:default",
"settings": {
"budgets": [
{
"resourceCounts": [
{ "resourceType": "total", "budget": 10 },
],
"resourceSizes": [
{ "resourceType": "total", "budget": 100 },
]
}
]
}
}
#### Option 2.
Generate with content like:` json`
[
{
"resourceCounts": [
{ "resourceType": "total", "budget": 10 },
],
"resourceSizes": [
{ "resourceType": "total", "budget": 100 },
]
}
]
Then run Lighthouse CI with the --budget-path flag
`sh`
$ lighthouse-ci https://example.com --report=reports --budget-path=budget.json
#### Option 3.
Pass individual parameters via CLI
`sh`
$ lighthouse-ci https://example.com --report=reports --budget.counts.total=20 --budget.sizes.fonts=100000
$3
Performance budgets can be specified inside your budget configuration file)(#budgets).
You can specify any available [performance budget like in the following example
`json`
[
{
"path": "/*",
"resourceSizes": [
{
"resourceType": "script",
"budget": 400000
},
{
"resourceType": "total",
"budget": 5050
}
],
"resourceCounts": [
{
"resourceType": "total",
"budget": 95
},
{
"resourceType": "third-party",
"budget": 55
}
]
}
]
$3
Timing budgets can be specified inside your budget configuration file)(#budgets).
You can specify any available [timing budget like in the following example
`json`
[
{
"path": "/*",
"timings": [
{
"metric": "interactive",
"budget": 100
},
{
"metric": "first-meaningful-paint",
"budget": 100
}
]
}
]
Codechecks
You can now easily integrate Lighthouse-CI as part of your automated CI with codechecks.io.
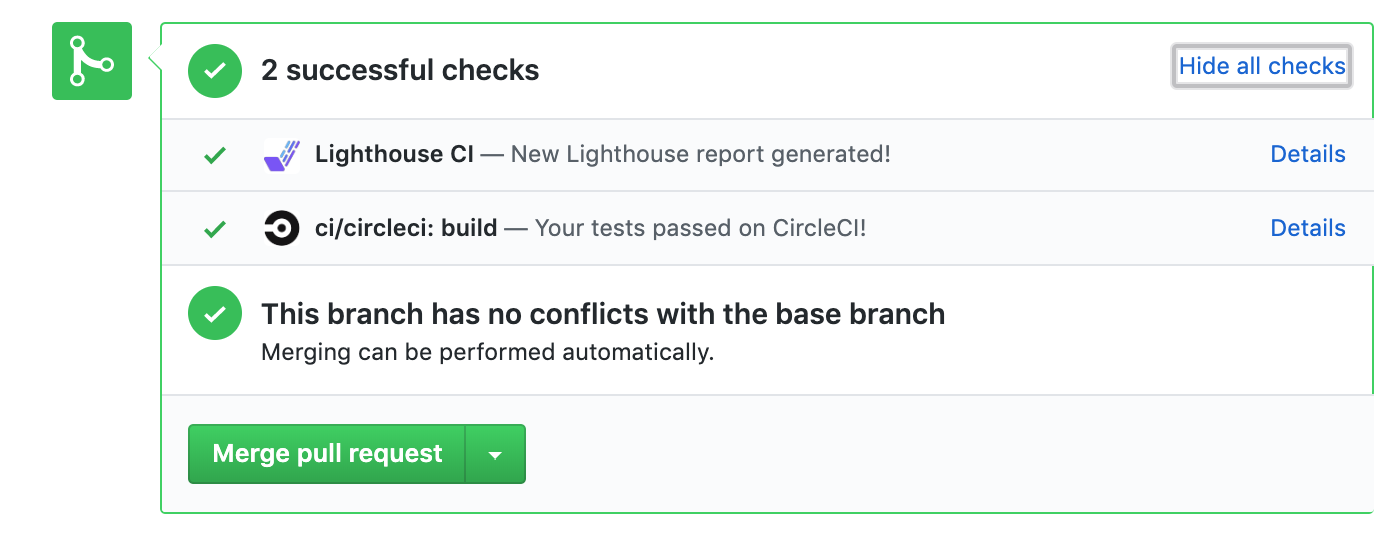
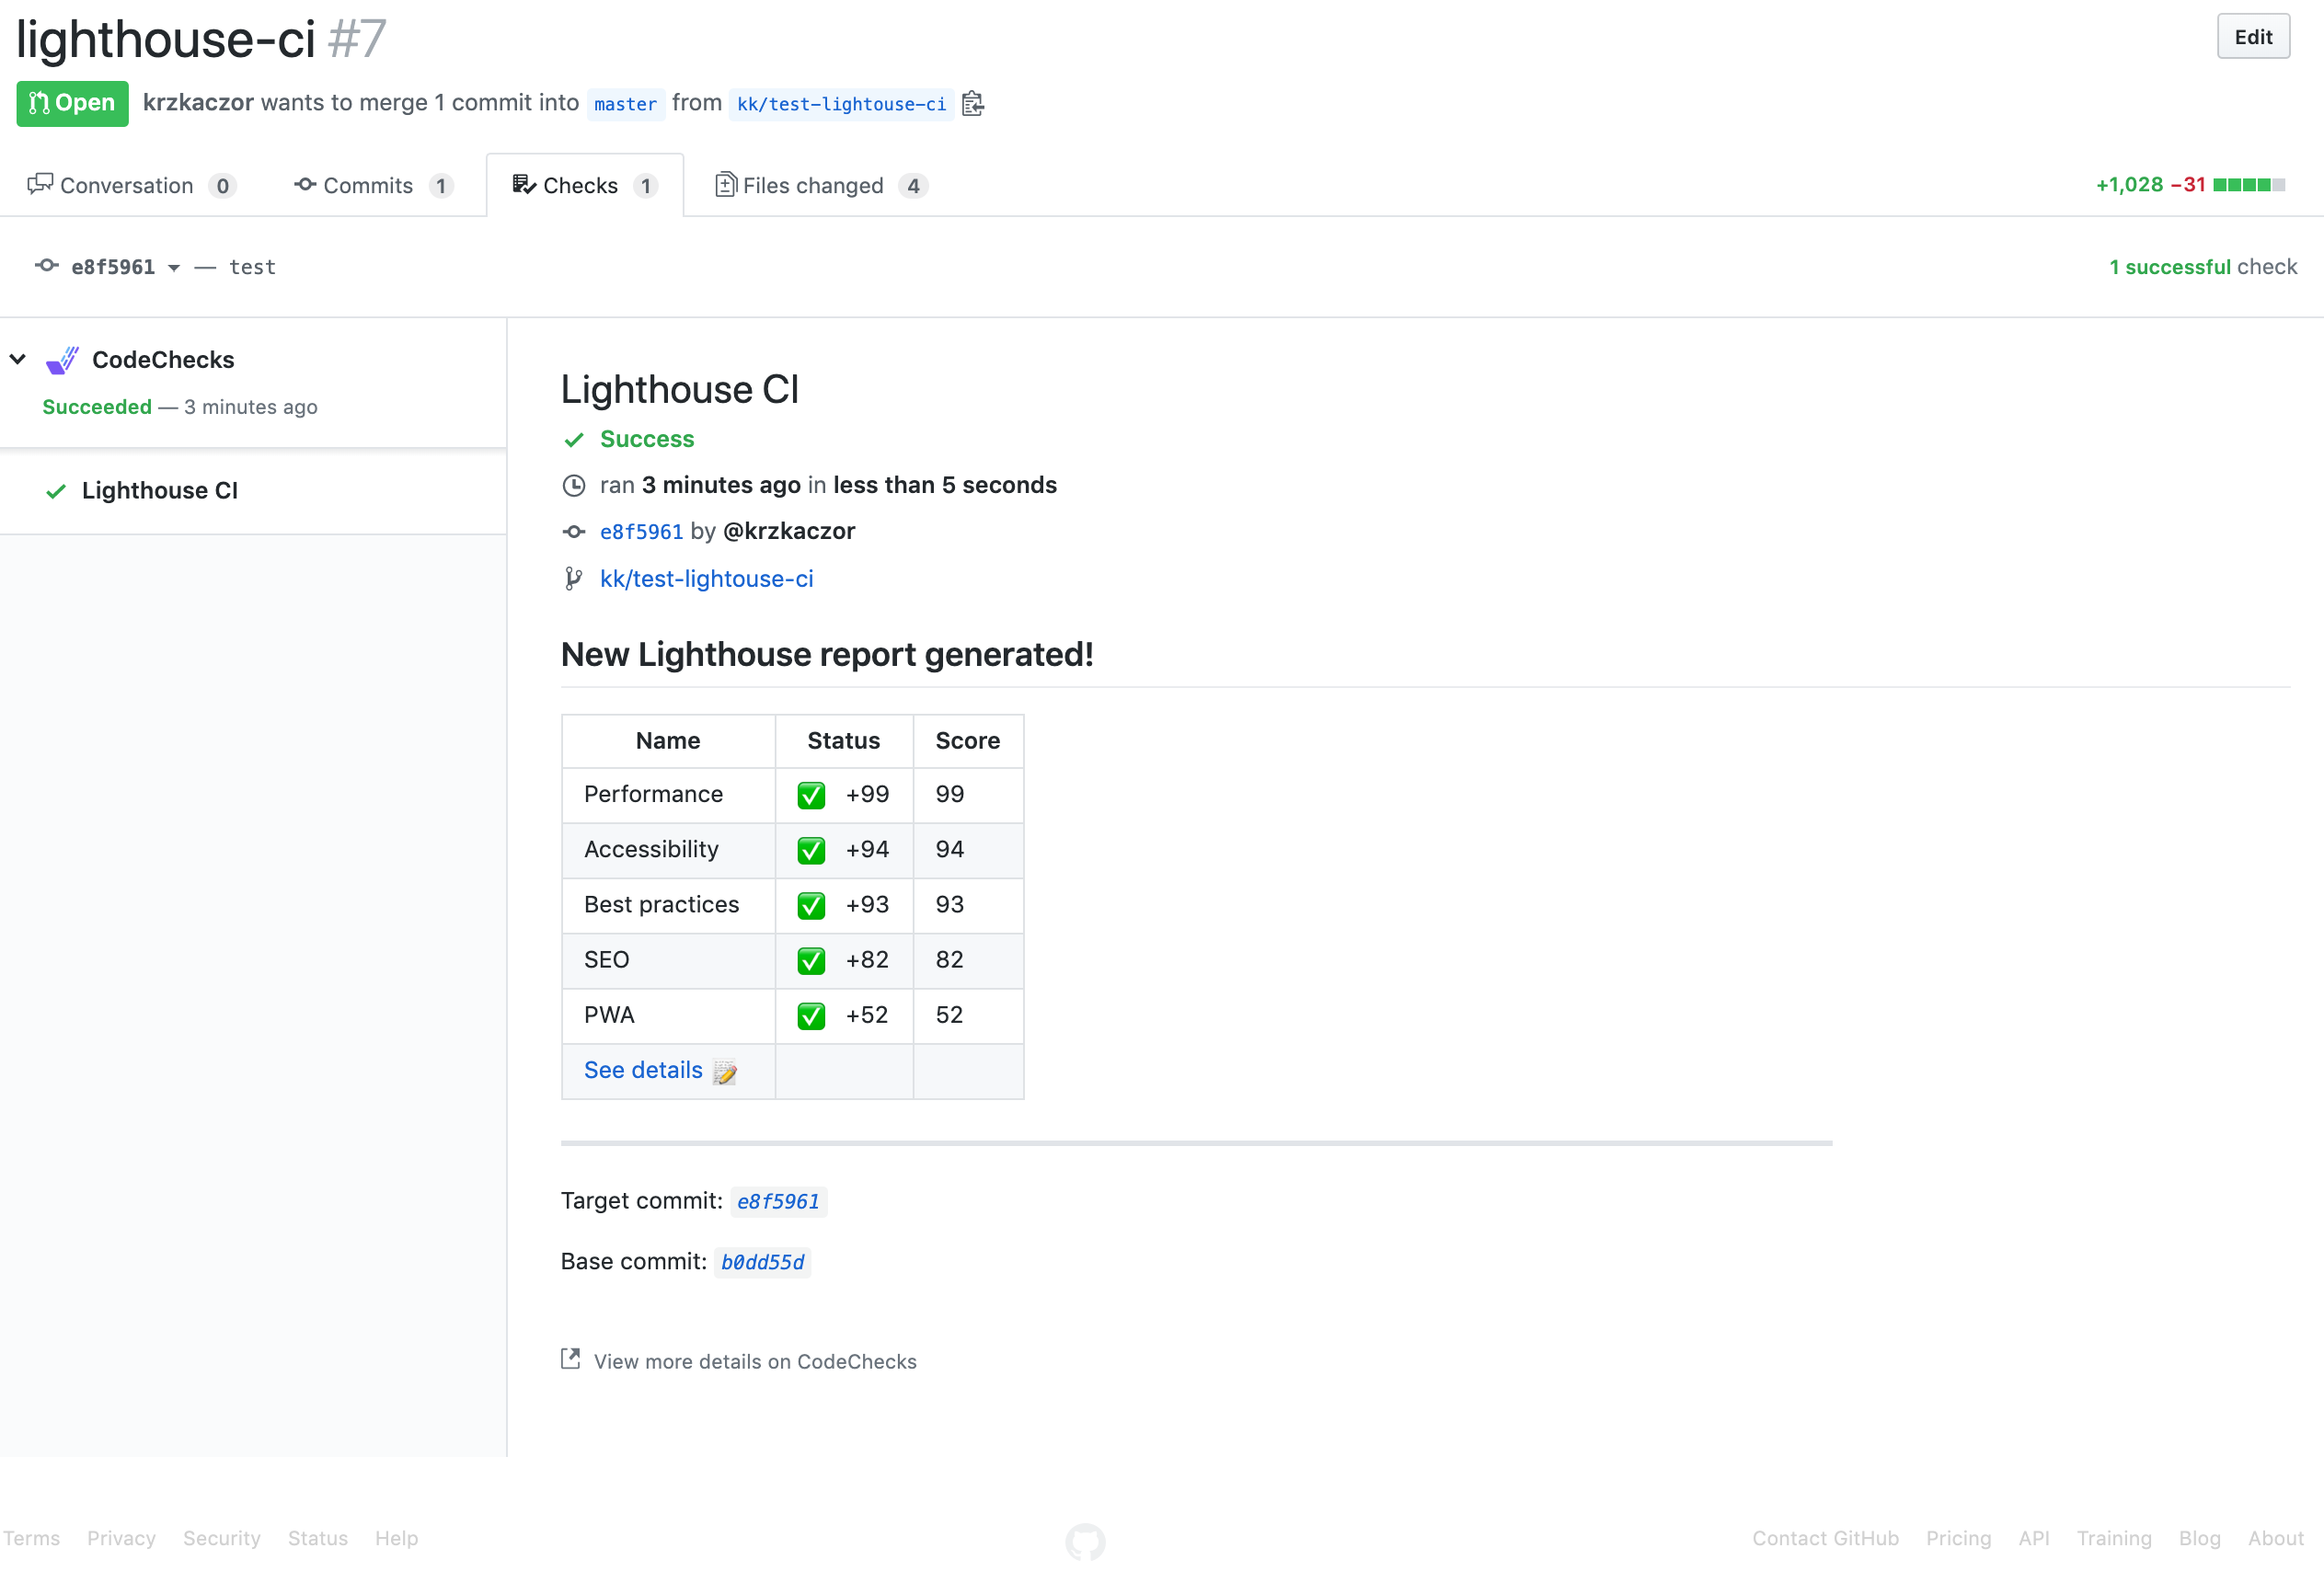
Running Lighthouse-CI with Codechecks
`sh`
$ npm install --save-dev @codechecks/client @codechecks/lighthouse-keeper
Now, create a codechecks.yml (json is supported as well) file required for codechecks to automatically run against your project.
codechecks.yml:
`yml`
checks:
- name: lighthouse-keeper
options:
# just provide path to your build
buildPath: ./build
# or full url
# url: https://google.com
# ...
Read more from the official documentation from https://github.com/codechecks/lighthouse-keeper.
Read more about Codechecks on the official project website
Demo App
This project contains a demo folder where a project as been created for demo purposes only.
Once inside the demo folder, if you have Docker installed on your machine, you can simply launch the demo app inside a Docker container with make demo.
If you just want to run the demo locally, make sure to install the node dependencies first with npm install,
then run the demo with:
`
$ npm start
How to
$3
By default lighthouse-cli is just creating the report against a specific URL without letting the engineer to interact with the browser.
Sometimes, however, the page for which you want to generate the report, requires the user to be authenticated.
Depending on the authentication mechanism, you can inject extra header information into the page.
`sh`
lighthouse-ci https://example.com --extra-headers=./extra-headers.js
Where extra-headers.json contains:
`js`
module.exports = {
Authorization: 'Bearer MyAccessToken',
Cookie: "user=MySecretCookie;"
};
$3
Your website might require extra time to load and execute all the JavaScript logic.
It is possible to let LightHouse wait for a certain amount of time, before ending a trace,
by providing a pauseAfterLoadMs value to a custom configuration file.
eg.
`sh`
lighthouse-ci https://example.com --config-path ./config.json
Where config.json contains:
`json``
{
"extends": "lighthouse:default",
"passes": [{
"recordTrace": true,
"pauseAfterLoadMs": 5000,
"networkQuietThresholdMs": 5000
}]
}
Contributors
Thanks goes to these wonderful people (emoji key):
 Andrea Sonny 💬 💻 📖 |  Celso Santa Rosa 💻 |  Ben Hammond 🐛 💻 |  Alex Tenepere 🐛 💻 |  Michael Griffiths 💻 |  Connor Markwell 💻 |  Sebastian Engel 🐛 💻 |
 Alex Smagin 💻 🤔 |  Marc Schaller 🐛 💻 |  Rémi Perrot 🐛 💻 |
This project follows the all-contributors specification. Contributions of any kind welcome!
License
MIT
---
Created with 🦄 by andreasonny83