ng-chartjs
v0.2.8TypeScript
This is a Angular chart.js library.
0/weekUpdated 2 years agoMITUnpacked: 225.4 KB
Published by flywine
npm install ng-chartjsng-chartjs  
A fully functional Angular2+ chart.js library.This chart library based on ng2-charts.

> Thanks to valor-software's ng2-charts.
| Angular | ng-chartjs| NPM package | chart.js |
| :---: | :---: | :---: | :---: |
| 15.x.x | 0.2.8 | ng-chartjs@0.2.8 | chart.js@>=3.0.0 |
| 15.x.x | 0.2.7 | ng-chartjs@0.2.7 | chart.js@>=3.0.0 |
| 14.x.x | 0.2.6 | ng-chartjs@0.2.6 | chart.js@^3.0.0 |
| 13.x.x | 0.2.5 | ng-chartjs@0.2.5 | chart.js@^3.0.0 |
| 12.x.x | 0.2.5 | ng-chartjs@0.2.5 | chart.js@^3.0.0 |
| 12.x.x | 0.2.4 | ng-chartjs@0.2.4 | chart.js@^2.9.4 |
| 11.x.x | 0.2.3 | ng-chartjs@0.2.3 | chart.js@^2.9.4 |
| 11.x.x | 0.2.2 | ng-chartjs@^0.2.2 | chart.js@^2.9.4 |
| 9.x.x | 0.2.1 | ng-chartjs@^0.2.1 | chart.js@^2.9.4 |
| 8.x.x | 0.1.9 | ng-chartjs@^0.1.9 | |
| 7.x.x | 0.1.1 | ng-chartjs@^0.1.1 | |
ng-chartjs already supports Chart.js 3.0, but the Chart.js 3.0 API is destructive, please use it with caution.
Usage & Demo
Installation
1.You can install ng-chartjs using npm
``
npm install ng-chartjs --save
2.You need to install Chart.js library in application.
npm install chart.js --saveUsage
API
Import
1.Normal import.
`
import { NgChartjsModule } from 'ng-chartjs';
// In your App's module:
imports: [
NgChartjsModule
]
`
2.Importing global plugin.
import { NgChartjsModule } from 'ng-chartjs';
// In your App's module:
imports: [
NgChartjsModule.registerPlugin([...])
]
`
3.Lazy Module
`
import { NgChartjsModule } from 'ng-chartjs';
// In your lazy module:
imports: [
NgChartjsModule.registerPlugin([...])
]
`
$3
- line
- bar
- radar
- pie
- polarArea
- ...
$3
#### inline plugin
Use the plugins Properties.
eg. source code
html file.`
  [datasets]="lineChartData"
  [labels]="lineChartLabels"
  [options]="lineChartOptions"
  [legend]="lineChartLegend"
  [chartType]="lineChartType"
[inlinePlugins]="inlinePlugin"> file.
`
...
import * as Chart from 'chart.js';';
lineChartData: Chart.ChartDataset[] = [
{
label: 'My First dataset',
fill: false,
tension: 0.1,
backgroundColor: 'rgba(75,192,192,0.4)',
borderColor: 'rgba(75,192,192,1)',
borderCapStyle: 'butt',
borderDash: [],
borderDashOffset: 0.0,
borderJoinStyle: 'miter',
pointBorderColor: 'rgba(75,192,192,1)',
pointBackgroundColor: '#fff',
pointBorderWidth: 1,
pointHoverRadius: 5,
pointHoverBackgroundColor: 'rgba(75,192,192,1)',
pointHoverBorderColor: 'rgba(220,220,220,1)',
pointHoverBorderWidth: 2,
pointRadius: 1,
pointHitRadius: 10,
data: [65, 59, 80, 81, 56, 55, 40],
},
];
lineChartLabels: Array
lineChartOptions: any = {
responsive: true
};
lineChartLegend = true;
lineChartType = 'line';
inlinePlugin: any;
textPlugin: any;
ngOnInit() {
// inline plugin
this.textPlugin = [{
id: 'textPlugin',
beforeDraw(chart: any): any {
const width = chart.width;
const height = chart.height;
const ctx = chart.ctx;
ctx.restore();
const fontSize = (height / 114).toFixed(2);
ctx.font = ${fontSize}em sans-serif;
ctx.textBaseline = 'middle';
const text = 'Text Plugin';
const textX = Math.round((width - ctx.measureText(text).width) / 2);
const textY = height / 2;
ctx.fillText(text, textX, textY);
ctx.save();
}
}];
this.inlinePlugin = this.textPlugin;
}
...
`
View

> The plugins properties is an array of objects that allows multiple inline plugins to be used simultaneously.
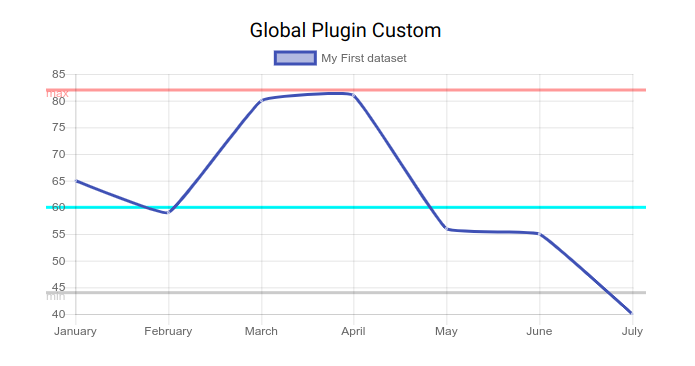
#### global plugin
Using the registration API in app.module.ts.
eg. source code
Customize global plugin.
`
export function horizonalLine(chartInstance: any) {
  const yScale = chartInstance.scales['y'];
  const canvas = chartInstance.canvas;
  const ctx = chartInstance.ctx;
  let index;
  let line;
  let style;
  let yValue;
if (chartInstance.options.horizontalLine) {
for (index = 0; index < chartInstance.options.horizontalLine.length; index++) {
line = chartInstance.options.horizontalLine[index];
if (!line.style) {
style = 'rgba(169,169,169, .6)';
} else {
style = line.style;
}
if (line.y) {
yValue = yScale.getPixelForValue(line.y);
} else {
yValue = 0;
}
ctx.lineWidth = 3;
if (yValue) {
ctx.beginPath();
ctx.moveTo(0, yValue);
ctx.lineTo(canvas.width, yValue);
ctx.strokeStyle = style;
ctx.stroke();
}
if (line.text) {
ctx.fillStyle = style;
ctx.fillText(line.text, 0, yValue + ctx.lineWidth);
}
}
return;
}
}
const horizonalLinePlugin = {
id: 'cutomline',
beforeDraw: horizonalLine
};
`
Register global plugin
`
import { NgChartjsModule } from 'ng-chartjs';
// In your App's module:
imports: [
NgChartjsModule.registerPlugin([horizonalLinePlugin])
]
`
html file.`
  [datasets]="lineChartData"
  [labels]="lineChartLabels"
  [options]="lineChartOptions"
  [legend]="lineChartLegend"
  [chartType]="lineChartType">
ts file.`
lineChartData: Chart.ChartDataset[] = [
{
label: 'My First dataset',
fill: false,
tension: 0.1,
backgroundColor: 'rgba(75,192,192,0.4)',
borderColor: 'rgba(75,192,192,1)',
borderCapStyle: 'butt',
borderDash: [],
borderDashOffset: 0.0,
borderJoinStyle: 'miter',
pointBorderColor: 'rgba(75,192,192,1)',
pointBackgroundColor: '#fff',
pointBorderWidth: 1,
pointHoverRadius: 5,
pointHoverBackgroundColor: 'rgba(75,192,192,1)',
pointHoverBorderColor: 'rgba(220,220,220,1)',
pointHoverBorderWidth: 2,
pointRadius: 1,
pointHitRadius: 10,
data: [65, 59, 80, 81, 56, 55, 40],
},
];
lineChartLabels: Array
lineChartOptions: any = {
responsive: true,
horizontalLine: [{ // use custom global plugin
y: 82,
style: 'rgba(255, 0, 0, .4)',
text: 'max'
}, {
y: 60,
style: '#00ffff',
}, {
y: 44,
text: 'min'
}]
};
lineChartLegend = true;
lineChartType = 'line';
View
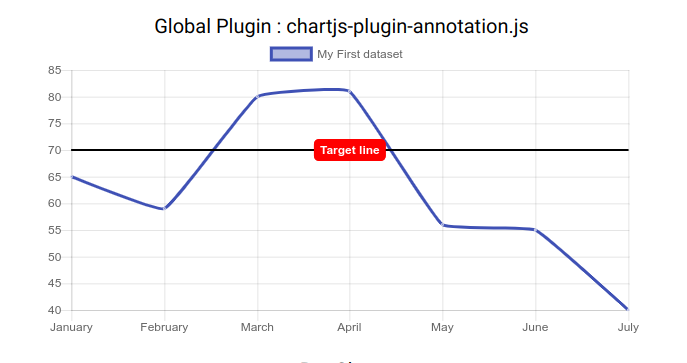
Import third-party plugin libraries.
eg. source code
`
import annotationPlugin from 'chartjs-plugin-annotation';
...
// In your App's module:
imports: [
NgChartjsModule.registerPlugin([annotationPlugin])
]
`
Using the plugin directly within the options property.
`
options = {
	responsive: true,
	annotation: {  // use global plugin.
    annotations: {
        line1: {
          type: 'line',
          value: 70,
          scaleID: 'y',
          borderColor: 'rgb(255, 99, 132)',
          borderWidth: 2,
          label: {
            backgroundColor: 'red',
            content: 'Target line',
            enabled: true,
            position: 'center',
            font: {
              weight: 'bold'
            }
          }
        },
        box1: {
          type: 'box',
          xMin: 1,
          xMax: 2,
          yMin: 50,
          yMax: 70,
          backgroundColor: 'rgba(255, 99, 132, 0.25)'
        }
      }
	}
};
View
> The parameter of registerPlugin function is an array of objects.
$3
Set the id attribute of the element,then Get the chart.js object by id. see source code
html file
`
              [datasets]="lineChartData"
        [labels]="lineChartLabels"
        [options]="lineChartOptions"
        [legend]="lineChartLegend"
        [chartType]="lineChartType"
        [resetOption]="resetOption">
file
`
...
import { NgChartjsService } from 'ng-chartjs';
...
ngInit() {
    const chart: any = this.ngChartjsService.getChart('testChart');
    chart.update();
}
...$3
html
@ViewChild('ngChartjs', {static: true})
private readonly ngChartjs: NgChartjsDirective;
$3
`
import { getColors } from 'ng-chartjs';
> generateColor, generateColors...$3
Property | Type | Explanation
---|---|---
data | Arrayonly for line, bar and radar, otherwise number[]
datasets | Array<{data: Array see about, the label for the dataset which appears in the legend and tooltipsline
labels | ?Array, bar and radar. And just labels (on hover) for charts: polarArea, pie and doughnut
chartType | ?string | indicates the type of charts, it can be: , bar, radar, pie, polarArea, doughnut
options | ?any | chart options (as from Chart.js documentation)
colors | ?Array
legend | ?boolean=false | if true show legend below the chart, otherwise not be shown
inlinePlugins | any[] | Chart.js inline plugin. Chart.js Plugins, Other Reference
adding | | You can add new data and update chart. It needs to be reassigned to trigger.{orientation: string}
removing | | You can delete the latest or oldest data.It needs to be reassigned to triggertrue
resetOption | any | Reset options can trigger update chart
noZone | boolean | Default value is , if enabled it, it will protected from zone effects and improve performance.
$3
- chart -- Get chartjs instance
- update -- Update chartjs
- addData -- Dynamically add data to chart
Parameter: labels and data
- remove -- Dynamically remove data to chart
Parameter: or latest`
$3
- chartClick : fires when click on a chart has occurred, returns information regarding active points and labels
- chartHover : fires when mousemove (hover) on a chart has occurred, returns information regarding active points and labels
License
The MIT License (see the LICENSE file for the full text)